
introduction
Local government is a sector in flux. In December 2024 the Government published the English Devolution White Paper to set out their vision of a simpler structure of local government to create better outcomes and more accessible services for residents. The aim of the White Paper is to create a consistent level of access to local public services and to devolve power to a stronger, more streamlined local government structure.
Although their property needs had been transforming in line with technological and social developments over the past 20 years, this will further accelerate the change to the way local government uses its property portfolios to provide these services. However, even with more increased access to remote working and service delivery technologies, there remains a need for all tiers of local government to retain a physical presence in the communities they serve.
It remains to be seen whether the White Paper will translate to widespread and fundamental restructure but there is a very real and present conflict between the need of Councils to retain property holdings to support service access for their communities with the need to balance their books. This is a challenge that is not going away any time soon.
The purpose of this research was to update the previous iteration of the study carried out in 2020 to understand the level and detail of information held by Councils, how they were using the data and whether there were obvious trends and / or anomalies across the different regions of the UK and within different Council types. It also seeks to understand the variance in energy spend and consumption for Councils across the UK and to begin to provide benchmarks and trend analysis that they may find useful.
Executive Summary
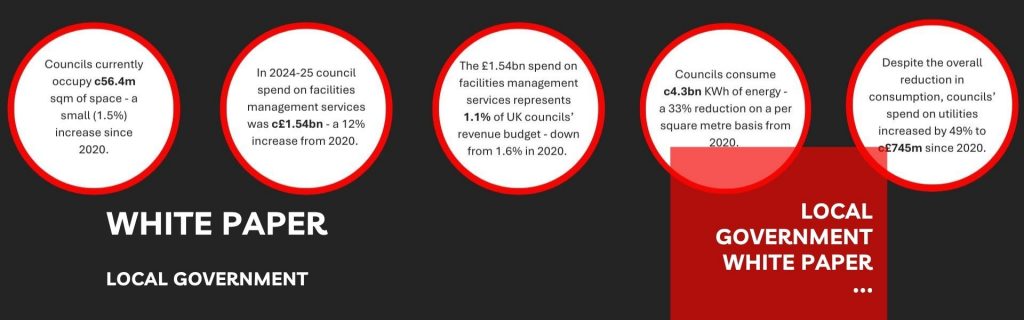
- Councils currently occupy c56.4m square metres of space from which they are delivering services to their communities (this does not include schools, housing stock or properties held for investment purposes) – a 0.5% increase in footprint since the 2020 exercise despite the fact that the number of local authorities has reduced from 396 to 371 in the corresponding period
- Councils spend an estimated £1.54bn per year on operational facilities management – a c12% (c£164m) increase since the 2020 exercise
- Of the estimated total sector spend of £134bn in 2024/2025, this represents 1.1% of the sector’s revenue budget – down from 1.6% in 2019/2020
- Councils consume an estimated 4.3bn KWh of energy – an estimated 33% reduction on a per square metre basis than in 2020
- Despite this reduction in consumption spend on utilities is an estimated £745m, £13.20 per per square metre, a c49% increase since 2020
- 52% of local authorities have provided any sort of response with only 42% able to provide the information asked for.
In most cases, where Councils refused to provide data it was because they had estimated that the time it would take to get hold of the data that was asked for would exceed their obligations without charging a fee.
Without sector guidance or a mandate to complete the data in a standard form (as there is within the NHS) there is, undoubtedly, a range of interpretations of the questions that were asked and of the properties that were to be considered ‘in-scope’ of the request. Of the meaningful data received, Councils claim to spend between £0.08/ sqm and £796.27 / sqm on facilities management services and consume between 0.22 KWh and 3,383 KWh for every square metre of their estate.
However, the majority and mean of the responses received were within a ‘to be expected’ range ensuring that the research provided meaningful results. Obvious anomalies in data are useful to that Council as they may demonstrate a different way of recording data or that there is something fundamentally wrong with their facilities management or utilities consumption and spend.
Methodology
The intention of the exercise was to establish the broad scale of local government spend of facilities management services as well as the consumption and spend of their utilities. To achieve this Councils were asked to populate a template spreadsheet for their portfolio of buildings that did not include;
- Schools
- Housing stock
- Any properties held for investment purposes
They were asked to provide the following
- Total number of properties
- Total Gross Internal Area (m2) of the properties identified
- The non-capital costs associated with providing the following services at these properties
- Repair and maintenance
- Cleaning
- Porterage
- Security
- Pest Control
- Reception
- Grounds Maintenance
- FM Management
- The KWh consumption of electricity, gas, oil and coal at these properties
- The cost of electricity, gas, oil and coal at these properties
The questions recognised that some Councils outsource facilities management services within bundled contracts and, therefore, have limited visibility of actual spend by each of the service categories mentioned. They were asked to include these costs in “FM Management”.
Councils were asked to include the costs (where known) of any in-house management or client teams to “FM Management” as this contributes to the cost of running the estate.
Councils were informed that there was no need to break down the spend / consumption data by site and that an aggregate for their authority would be suitable.
Of the 371 Councils canvassed as part of the research replies were received from 212 with 156 providing any form of meaningful data. These 156 organisations are referred to hereafter as responders.
For the purposes of this report and to provide a more comprehensive national view, we have extrapolated responses for each authority type (County, District, Unitary and Metropolitan Councils) to identify an estimated data set for these each type of authority.
Space Occupancy
- 74% of responders to the survey could identify their Gross Internal Area
- 96% of responders to the survey could identify the number of sites within their portfolio
- From responses that were received it is estimated that Councils occupy over 46,470 properties and a Gross Internal Area of 56.4million m2 (a small 0.5% increase since the 2020 survey) across England, Scotland and Wales – more than double that of the NHS estate
- This means that, on average each Council site occupies 1,215 m2, an 18% increase since the 2020 survey.
Of the responders, 149 Councils were able to identify the number of sites held within their operational portfolio. These Councils identified an aggregate of 17,220 different properties extrapolated to 46,473 different properties managed by Councils across the UK. This represents a 15% decrease since the 2020 survey.
Of the 156 responses received, only 116 Councils were able to identify their Gross Internal Area for their buildings. This accounted for 17,827,527 m2 of space extrapolated to 56,480,900 m2 by using the average per Council type.
| Council Type (Council Nos.) | Estimated Aggregate Property Nos. (delta to 2020 survey) | Estimated Aggregate GIA (m2) (delta to 2020 survey) | Estimated Average Property GIA (m2) (delta to 2020 survey) |
| District (169) | 4,420 (-48.7%) | 19.3m (+38.8%) | 4,377 (+170.1%) |
| County (25) | 6,400 (-2.4%) | 12.8m (+161%) | 1,998 (+170.0%) |
| Unitary (108) | 29,362 (+1.5%) | 17.8m (-30.1%) | 608 (-30.9%) |
| Metropolitan (69) | 6,291 (-40.8%) | 6.4m (-43.9%) | 1,030 (-3.9%) |
As anticipated, Unitary Authorities (responsible for both tiers of local government service to their communities) occupy the largest property portfolios with an estimated aggregate Gross Internal Area of 29.3m m2 across an average of 267 properties per Council. District Councils occupy, on average, the smallest portfolios with an average of 51 properties per Council – although this has increased from 46 during the previous survey.
It is interesting to note the average property size by different authority type. As well as operating within smaller geographical areas, District Councils appear to continue to have been more successful at consolidating their occupancy to fewer, larger buildings (on average their properties are 4,377 m2) which will, inevitably be more efficient to run. County Councils – often operating in rural areas – occupy, on average 262 sites per Council but these are, on average, over 50% smaller than District Council sites at 1,988m2.
Since the 2020 survey, there has been considerable change to the make-up of Council’s property portfolios by Council type. District Councils have, on average, consolidated their estate significantly reducing the number of properties they occupy by almost half yet increasing their footprint by 39%. Metropolitan Councils have reduced their footprint by 41% in terms of number of buildings and appear to have consolidated their overall requirement for space by reducing the average size of the buildings that they do occupy by 4%.
Facilities Management
- Overall the quality and consistency of the data received varied enormously between different authorities – suggesting that Councils have little assurance that the data they hold about their estate is complete and accurate
- Meaningful data was returned by 145 Councils
- From responses that were received, Councils have identified annual spend on operational facilities management of £486m which has been extrapolated to estimate that annual spend across all Councils in England, Scotland and Wales is £1.54bn per year – c1.1% of UK Council’s annual revenue budgets
- This represents a square meterage spend of £27.24 – up 11% from the £24.51 recorded as part of the 2020 survey.
- There are significant discrepancies between FM costs incurred by Councils in different regions in the UK.
Service Category
From the responses received, it is clear that the largest category of FM spend (38%) is within the Maintenance & Repair category (c£580m). As Councils were asked to provide only operational expenditure and not capital project costs actual maintenance, repair and upgrade costs are likely to be significantly larger given the age and legacy condition of many Council properties.
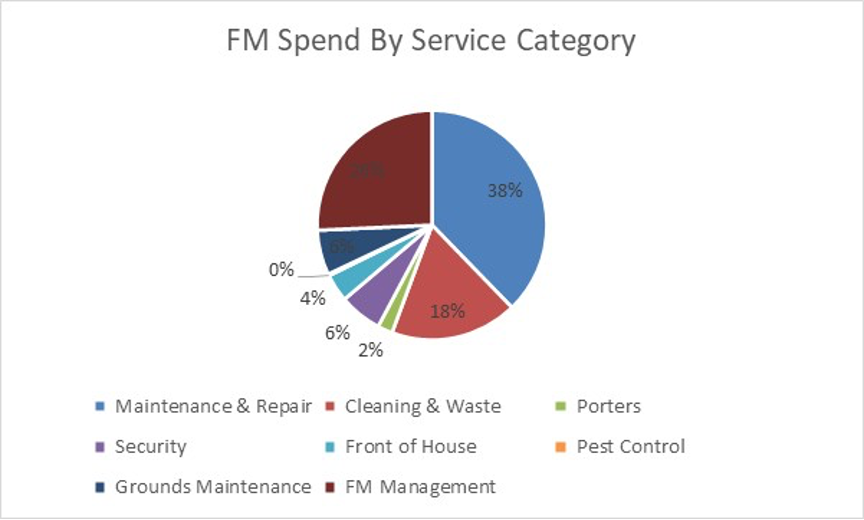
FM Management costs (c£396m – 26% of FM spend) are likely to include the cost of client and management teams overseeing services but also the costs to the Councils of integrated or bundled FM contracts with third party suppliers where they do not necessarily have visibility of the split by service category.
Council Type
From responses received it appears that, on average, there is a significant range paid for FM services by different Council types.
| Council Type | Estimated Per Council FM Spend (delta to 2020 survey) | Estimated FM Spend / m2 (delta to 2020 survey) |
| District Councils | £1.12m (+2.75%) | £9.79 (-34.6%) |
| County Councils | £11.02m (+66.7%) | £21.55 (-41.4%) |
| Unitary Authorities | £4.75 (-2.1%) | £28.70 (+39.7%) |
| Metropolitan Authorities | £8.13m (+23.6%) | £86.57 (+117%) |
| Total | £4.18m (+20.5%) | £27.24 (+11.3%) |
Despite being the smallest authorities, District Councils are, on average, spending the lowest £/m2 of all authority types. This may be explained by the apparent consolidation of their portfolios explored in the Space Occupancy analysis above – they are, increasingly, operating from fewer, larger buildings where they are able to generate greater economies of scale. This will be supported by the size of the communities they serve – by default these are smaller than other authority types.
Metropolitan Councils are spending a significantly higher amount of FM services than, either other types of authority and recognised industry benchmarks for non-complex office environments. Since the 2020 survey, this has increased by an enormous 117% – with almost all of the delta being attributed to the Repair & Maintenance category suggesting that Metropolitan Councils – often created from legacy organisations with ageing estates – are dealing with a growing repair bill for these buildings.
Regional Differences
Across the UK there are a number of differences between FM spend / m2 in different regions.
| Council Type | Estimated Per Council FM Spend (delta to 2020 survey) | Estimated FM Spend / m2(delta to 2020 survey) | Average Council GIA (m2) (delta to 2020 survey) |
| North West | £4.72m (+35.1%) | £39.10 (+23.1%) | 120,941 (+10%) |
| North East | £7.41m (+53.7%) | £49.39 (+58.7%) | 149,944 (-3.2%) |
| South West | £3.76m (+33.8%) | £25.41 (+44.7%) | 147,897 (-7.7%) |
| Midlands | £3.23 (23.8%) | £22.87 (+25.9%) | 141,335 (-1.8%) |
| London | £7.26m (+10.5%) | £84.70 (+87.9%) | 85,755 (-41.1%) |
| South East | £2.54m (+23.9%) | £11.81 (-38%) | 214,637 (+99.8%) |
| Scotland | £5.43m (-15.3%) | £35.95 (+26.6%) | 128,261 (-32.9%) |
| Wales | £4.36m (+1.6%) | £29.53 (+33.9%) | 147,715 (-24.1%) |
London Councils continue to spend the most on FM services on a £/sqm basis. This is reflected in the fact that they are all Metropolitan Councils and could be explained by the higher costs of labour and supplier overheads in this region.
In terms of the trend of change since the 2020 survey, Councils across the country have managed to reduce the size of their footprint with the exception of those in the North West and, especially in the South East where the analysis would appear to present a discrepancy in the data collected. This has also driven a reduction in £/sqm spend on FM in this region and would, again indicate a discrepancy in the data.
Spend on FM in the North East and North West continues to be the highest outside of London.
Utilities
- Only 123 Councils of the 157 from whom meaningful responses were received were able to share either spend or consumption data for their utilities
- Of the responses received Councils reported over 1.3bn KWh of energy were used across their portfolios in 2024 / 2025, spending £237.2m
- Extrapolated across all Councils this is equivalent to approximately 4.3bn KWh – a 32.8% reduction since the 2020 survey – and £744m of spend – a 48.8% increase since the 2020 survey.
- 2025 consumption equates to 76.7KWh / sqm and £13.19 / sqm – a 49.9% increase since the 2020 survey
- Councils across are paying between £0.05 and £0.17 per KWH consumed
- Of the responses received, no Councils reported any spend on Coal as part of the 2025 survey – in 2020, Council’s reported £93k
- As part of the 2025 survey, Councils reported 38m KWh generated through Solar
As a sector, Councils consume an estimated 6.4bn KWh of energy each year – and this has remained almost static since the 2020 survey – a small increase of 1.6%. This aligns to the analysis of total space occupied also being static between the two surveys. However, Utilities costs have increased significantly (by almost half) over the same period. Undoubtedly a number of high profile macro-economic factors will have affected this and highlight the challenge to local government finance.
Councils across England, Scotland and Wales occupy over twice as much space as the NHS (secondary care and ambulance services). Despite this and, perhaps unsurprisingly, the energy consumed is only around 38% of that consumed by the NHS although spend is a higher proportion at 83% of that spent by NHS Trusts.
| NHS Trusts (2024/2025 ERIC Return) | Councils | |
| Gross Internal Area (m2) | 27.7m | 56.4m |
| Energy consumed (KWh) | 11.3bn | 4.3bn |
| KWh / m2 | 407 | 76 |
| Energy Costs | £1.25bn | £744.9m |
| Energy Costs / m2 | £45.13 | £13.19 |
| Energy Costs / KWh | £0.11 | £0.17 |
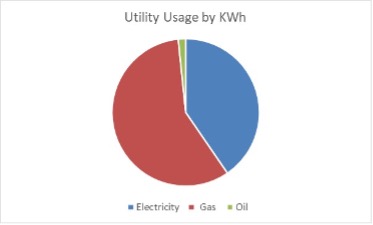
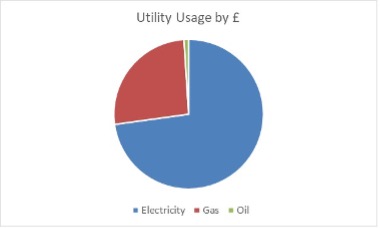
In terms of bought energy, Gas is the dominant energy source with c58% by KWh consumed. However Electricity is Councils’ largest spend in terms of utilities with an estimated £542m per year (73%) of all spend. Across Councils’ portfolios, they continue to spend c£7.4m on Oil.
Council Type
From responses received it is estimated that there is a reasonable range paid by each Council type for each KWh – between £0.05 and £0.17. There is, however, significant variance between the energy efficiency and spend / m2 of different organisation types.
| Council Type | Energy Consumption (KWh / m2) (delta to 2020 survey) | Energy Spend (£ / m2) (delta to 2020 survey) |
| District | 25.44 (-46%) | £5.06 (+28.8%) |
| County | 37.37 (-76%) | £8.82 (-40%) |
| Unitary | 125 (+9.4%) | £19.67 (+131.9%) |
| Metropolitan | 173.9 (-4.4%) | £28.23 (+110%) |
Again, District Councils and their apparent approach to consolidate building usage into fewer, larger sites appears to be allowing them to use significantly less energy than other Council types. Since the 2020 survey, County Councils have made the biggest apparent improvements both in terms of consumption / sqm and spend / sqm. It will be fascinating to see whether this trend continues under the plans outlined in the Devolution White Paper.
Unitary and Metropolitan authorities appear to have some work to do to improve the performance of their estates to make District and County Councils. Their energy spend profiles are also considerably higher.
Of course, as is the case nationally, spend on utilities has been significantly impacted by a series of high profile global macro-economic factors. This has translated into increased spend across all Council types (with County Councils being the exception) despite reduced consumption.
In general, Councils are making good progress in terms of reduction to their energy consumption. This has been enhanced by Councils growing understanding of renewable energy and a reduction in infrastructure costs to generate it. As part of this survey data has been collected on solar production identifying 38m KWh being produced by this method, it will be interesting to see how this changes over the next few years.
Conclusion
From the research undertaken it does appear that Councils continue to face significant challenges in terms of the data they hold about their estate. Of the 371 Councils canvassed as part of this exercise, meaningful data was received from only 157 (42.3%). Responses were also received from a further 56 Councils who stated that to collect the data asked for would have taken longer than the ‘appropriate limit’ and they were, therefore, unable to respond.
This lack of access to detailed knowledge creates additional challenges for Councils;
- Often Councils do not know what buildings they are responsible for or how much they are spending on maintaining them
- They cannot effectively control the health and safety risk associated with their responsibility for these buildings
- They cannot effectively control the commercial risk – especially where third party providers are involved – from delivering services to these buildings
- Councils are often not equipped with all of the information they need from which to make strategic decisions about their property portfolios.
From the data collected, analysed and estimated as part of this research a number of conclusions can, reasonably, be drawn.
- There is no consistency in the way that Councils hold information about their property portfolios and / or the services that keep them operational
- Despite the reduction from 396 to 371 Council’s (either as a result of, or pre-empting the Devolution White Paper), the space that Councils occupy has not shrunk commensurately…in fact it has grown very slightly. This suggests that the some of the efficiency benefits of the simplified structure – especially in two tier Council areas – has yet to be realised.
- Spend on FM services has grown from c£1.37bn to £1.54bn – a 12.4% increase – which represents a 11.3% increase to costs on a £/sqm basis, a marginal increase to efficiency.
- Metropolitan – single tier urban based – Councils appear to have FM costs significantly above accepted benchmarks for costs in non-complex environments.
- Councils have – generally – made significant progress in reducing their utilities consumption on a KWh / sqm basis. Due to high profile macro-economic factors, this has not translated into a commensurate reduction in costs.
It appears that the quality of data available to each Council from which they can make key strategic decisions about their property is relatively low and, critically, from which they can demonstrate with absolute assurance that they are comprehensively compliant with their statutory obligations around health and safety
In terms of FM spend there are significant regional variances which are difficult to explain. It is likely that some of them will be explained by differing methods of data collection but is also likely to highlight a lack of consistency around approach to delivering and procuring FM services and a lack of risk control associated with it
The exercise has demonstrated the overall lack of detailed understanding both at Council but also wider level about the age, condition and cost of running and operating the local authority property portfolio in the UK.
Councils’ portfolios are wildly varied in terms of age, condition and location – and therefore operational cost and risk. Their place in the communities they serve means that greater, demonstrable control over this risk, as well as clearer commercial probity is required to ensure that portfolios are fit for their future purpose and able to anticipate as well as react to changing demographic demands.